Models are used to represent the physiological spaces and the exchanges between them
Important definitions:
- Cl = Clearance Rate: Indicates the excretion rate of the drug (Pharmacokinetics of Excretion)
- Cl = Kel x Vd
- Kel = Constant of elimination: Represents the slope of the first order elimination in a semi-logarithmic plot
- Kel = (ln C1 - ln C2) / (t2 - t1)
- Cp0 = Plasma concentration at time equals 0: Repesent the maximum plasma concentration, when the dose is given as an IV bolus
- Vd = Apparent volume of distribution (Pharmacokinetics of Distribution)
- Vd = Dose / Cp0
- t1/2el = Half life of elimination: Time required to eliminate half of the total concentration
- t1/2el = ln(2) / Kel
- 5 x t1/2 (Five half lives rule): Five times the duration of t1/2, it allow to reach 97% of the steady state concentration (Cpss), or to eliminate 97% of the drug (When we are using t1/2el)
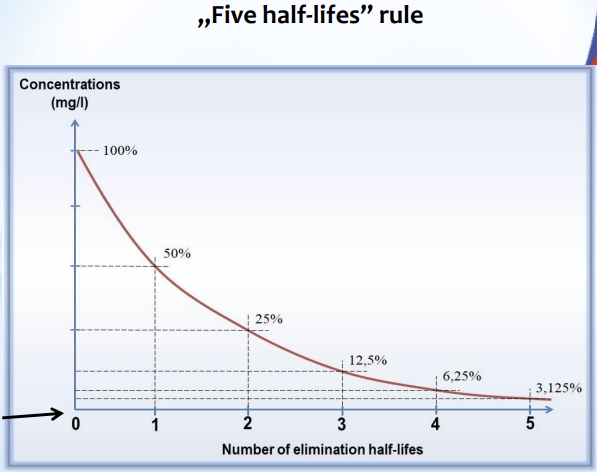
Five half lives rule
The drug is given as an IV bolus at t=0
97% of it is eliminated at t = (5 x t1/2el)
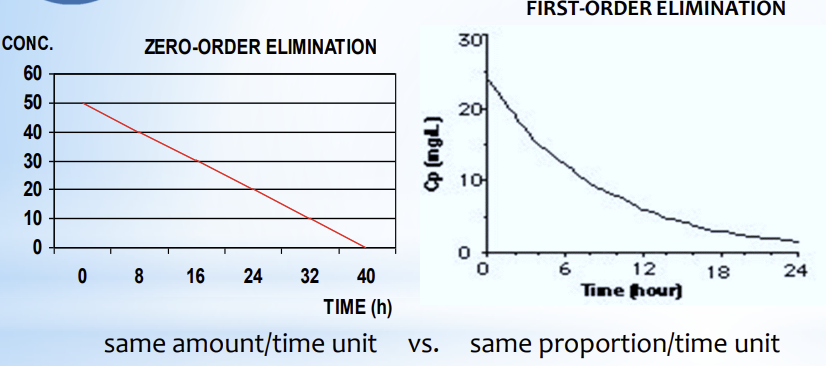
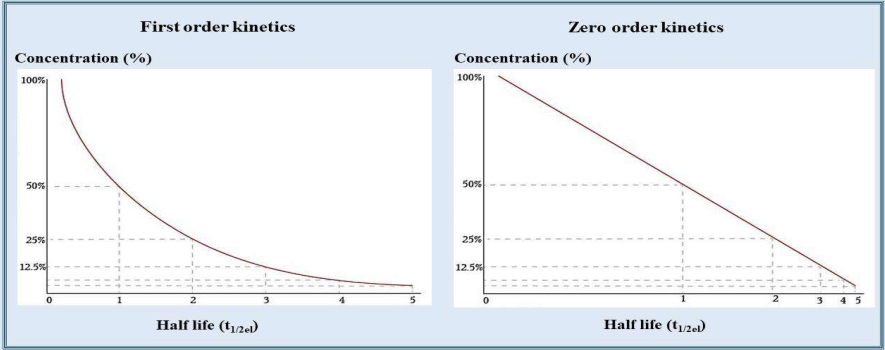
| Zero-Order Elimination | First-Order Elimination |
|---|---|
| Clearance rate is constant | Clearance rate evolves with time |
| Excretion of the same amount of drug per unit of time | Excretion of the same proportion of drug per unit of time |
| Linear curve in an cartesian plot | Exponential curve in an cartesian plot Linear curve in a semi-logarithmic plot |
| Zero order elimination can be a sign of organ failure / metabolism saturation | Most drugs have a first order elimination |
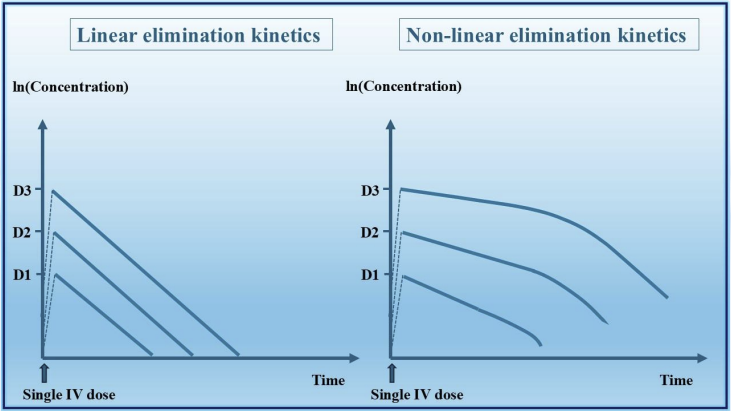
| Aspects | Linear Pharmacokinetics | Non-Linear Pharmacokinetics |
|---|---|---|
| ADME Processes | All follow 1st order | At least one doesn’t follow first-oder kinetics |
| Dose dependance of rates | Independent Cl, Kel, t1/2el remain the same with time | Dependent Cl, Kel, t1/2el change with time |
| Changes in dose | Causes proportional changes in plasma level | Causes disproportional changes in plasma level |
Compartments modelling:
0) The administration compartment (Ex: Oral absorption from the GI) and elimination compartment (Ex: Elimination in the urine) don’t count as compartments
1) The compartments that count can exchange both ways with the central compartments, it is not the case with the administration and elimination compartments
- 1 Compartment model: Only the IV compartment
- Exchanges described by:
- Ka = Constant of absorption of the drug into the IV compartment
- Kel = Constant of elimination of the drug from the IV compartment
- Graphic representation
- Bolus:
- Cartesian plot: Exponential curve
- Semi-logarithmic plot: Linear curve
- Cp = C0 x exp(-ke x t)
- Total IntraVeinous Anesthesia TIVA:
- Infusion with slow administration of drug (Pharmacokinetics of Absorption)
- Phase 1: Wash in
- The drug enters the IV compartment quickly at the beginning then slows down until it reaches a plateau phase
- Cp = Dose / (Cl x (1-exp(-k x t)))
- Phase 2: Steady state
- Plateau phase: The plasma concentration of the drug is constant with time because the administration and elimination speeds are in equilibrium
- Cpss = Dose rate / Cl
- Wash out
- The drug is not administrated anymore, it is eliminated from the system
- Cp = B x exp(-t x 0.693 / t1/2)
- Bolus:
- Exchanges described by:
- 2 Compartment models: IV compartment + 1 Peripheral compartment
- Exchanges described by:
- Ka = Constant of absorption of the drug into the IV compartment
- Kel = Constant of elimination of the drug from the IV compartment
- K12: Constant of the transport of drug from the IV compartment (Compartment 1) to the peripheral compartment (Compartment 2)
- K21: Constant of the transport of drug from the peripheral compartment (Compartment 2) to the IV compartment (Compartment 1)
- The body generally behaves as a 2 compartment model:
- Central compartment: Rapid and instantaneous equilibrium between the Blood and Highly perfused organs
- Peripheral compartment: Slower exchange rates with the less perfused organs lead to slowly setting equilibrium with the central compartment
- Cp = - N x exp(-Ka x t) + A x exp(-α x t) + B x exp(-β x t)
- Graphic representation:
- Bolus:
- Cartesian plot: 2 Phases in the curve
- Semi-logarithmic plot: 2 different linear phases with different slopes
- Bolus:
- Exchanges described by:
- Multi compartment models: IV compartment (Compartment 1) + Multiple peripheral compartments (Compartments 2, 3, 4 …)
-
- Exchanges described by:
- Ka = Constant of absorption of the drug into the IV compartment
- Kel = Constant of elimination of the drug from the IV compartment
- K12, K21, K13, K31, K14, K41 …
- The 3 compartment model represents well the redistribution phenomenon from a tissue back to the blood
- The Pharmacokinetics of Excretion are defined by 3 phases here:
- α: Fast distribution of the drug in the tissues
- β: Fast elimination of the drug (Ex: Through the urine)
- γ: Slow redistribution of the drug from the tissues back to the blood, limiting the elimination rate (Like in Flip-flop kinetics)
- Aminoglycosides (Such as Gentamicin) bind the Renal Cortex and get redistributed from there back to the blood
- Thiopental, Fentanyl and Propofol bind the Fatty Tissue and get redistributed from there back to the blood
- These drugs are less effective in obese animals and take more time to be eliminated
- The Pharmacokinetics of Excretion are defined by 3 phases here:
-
- Physiologically Based PharmacoKinetic PBPK models
- Constructed from interconnected compartments using differential equations describing their exchanges
- Include multiple compartments that represent actual physiology (Ex: Organs and Blood)
- Incorporate data from diverse sources which can allow to extrapolate and make prediction on the Pharmacokinetics
- Can help determining the correct amount and route of application for efficient Antimicrobial Drugs (Etiotropic Agents) use
- Non-Compartmental Pharmacokinetics Modelling:
- Use artificial mathematical compartment which aren’t directly related to the real physiological spaces
- This modelling system is heavily relying on the estimation of Total Drug Exposure (Often estimated by the Area Under the Curve)
- Mean Residence Time MRT: Mean duration of exposure of the body to the drug
- Area Under the Curve AUC: Shows the concentration of the drug evolving along the time axis
- Area Under the First Moment Curve AUMC: Shows the concentration of the drug weighted (By multiplying it) to the time it has spent in the body, evolving along the time axis
- MRT = AUMC / AUC
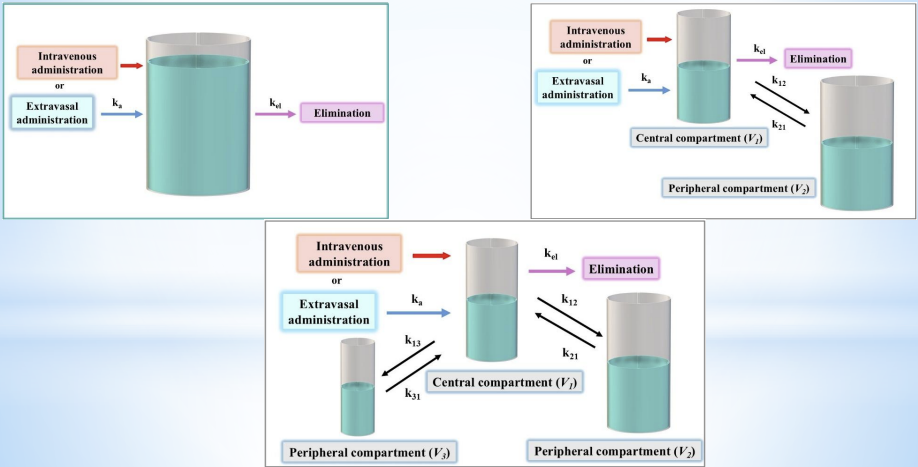
1, 2 and 3 compartments models
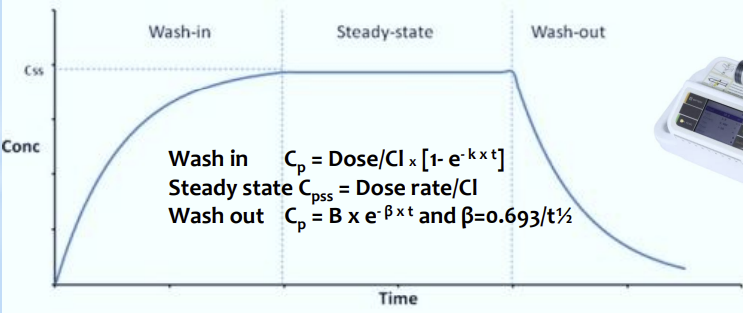
One compartment TIVA model
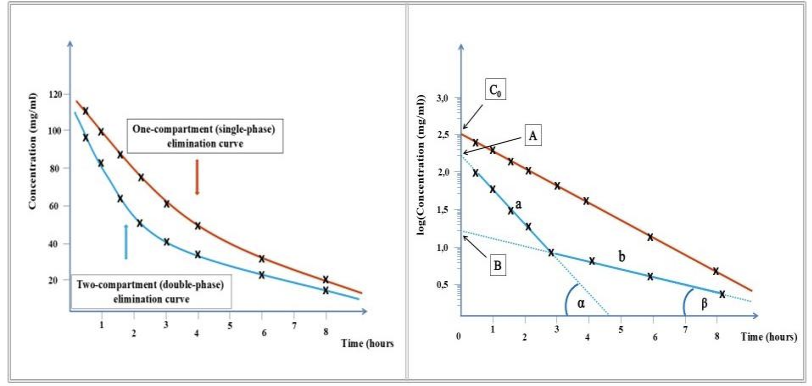
Two compartment Bolus model on a Cartesian plot (Left) and a Semi-logarithmic plot (Right)
The first half of the plot shows the kinetics of Absorption + Elimination
The second half of the plot shows the kinetics of Elimination only
Flip-flop kinetics:
- When the given drug is a long acting formulation with a slow absorption, the absorption rate is limiting the elimination rate (The drug can’t be eliminated faster than it can enter the IV compartment)
- The short acting formulations elimination curves become parallel with each other once their concentrations have peaked
- Because after peaking, they are mostly being eliminated > Their dynamics are defined by the elimination constant Ke
- The long acting formulations have a much more flat (Horizontal) curve which is not parallel to the other formulation’s curves (Flip flop phenomenon)
- It doesn’t peak, it keeps being absorbed for a long time
- The dynamics are defined by the absorption constant Ka
- The short acting formulations elimination curves become parallel with each other once their concentrations have peaked
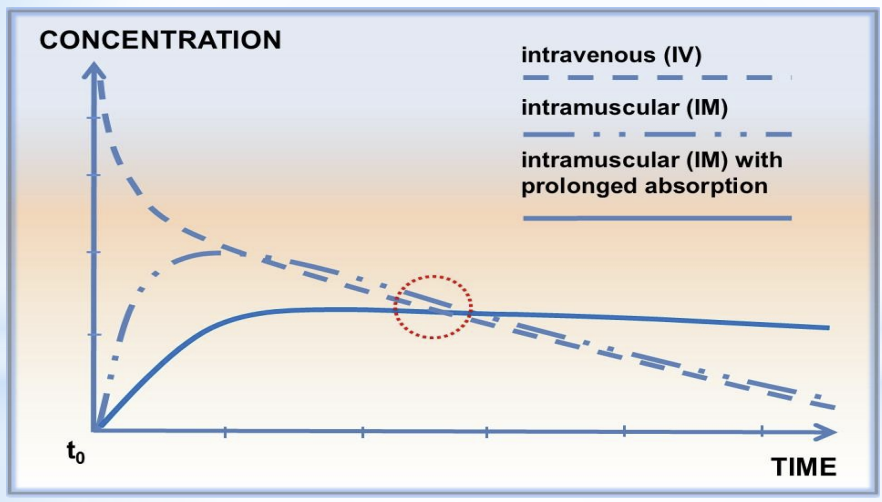
Flip-Flop Kinetics:
- The short acting formulations have a parallel curve when they are mostly being eliminated
- The long acting formulation’s curve isn’t parallel to them